


NCERT TEXT BOOK EXERCISES
EXERCISE-3.1
- Find the range of heights of any ten students of your class.
- Organise the following marks in a class assessment, in a tabular form.
4, 6, 7, 5, 3, 5, 4, 5, 2, 6, 2, 5, 1, 9, 6, 5, 8, 4, 6, 7
(i) Which number is the highest?
(ii) Which number is the lowest?
(iii) What is the range of the data?
(iv) Find the arithmetic mean.
- Find the mean of the first five whole numbers.
- A cricketer scores the following runs in eight innings:
58, 76, 40, 35, 46, 45, 0, 100
Find the mean score.
- Following table shows the points of each player scored in four games:
| Player | Game 1 | Game 2 | Game 3 | Game 4 |
| A | 14 | 16 | 10 | 10 |
| B | 0 | 8 | 6 | 4 |
| C | 8 | 11 | Did not play | 13 |
Now answer the following Ps:
(i) Find the mean to determine A’s average number of points scored per game.
(ii) To find the mean number of points per game for C, would you divide the total points by 3 or by 4? Why?
(iii) B played in all the four games. How would you find the mean?
(iv) Who is the best performer?
- The marks (out of 100) obtained by a group of students in a science test are 85, 76, 90, 85, 39, 48, 56, 95, 81 and 75. Find the:
(i) Highest and the lowest marks obtained by the students.
(ii) Range of the marks obtained.
(iii) Mean marks obtained by the group.
- The enrolment in a school during six consecutive years was as follow:
1555, 1670, 1750, 2013, 2540, 2820
Find the mean enrolment of the school for this period.
- The rainfall (in mm) in a city on 7 days of a certain week was recorded as follows:
| Days | Rain fall (in mm) |
| Monday | 0.0 |
| Tuesday | 12.2 |
| Wednesday | 2.1 |
| Thursday | 0.0 |
| Friday | 20.5 |
| Saturday | 5.5 |
| Sunday | 1.0 |
(i) Find the range of the rainfall in the above data.
(ii) Find the mean rainfall for the week.
(iii) On how many days was the rainfall less than the mean rainfall.
- The heights of 10 girls were measured in cm and the results are as follows:
135, 150, 139, 128, 151, 132, 146, 149, 143, 141
(i) What is the height of the tallest girl?
(ii) What is the height of the shortest girl?
(iii) What is the range of the data?
(iv) What is the mean height of the girls?
(v) How many girls have heights more than the mean height.
EXERCISE-3.2
- The scores in mathematics test (out of 25) of 15 students is as follows:
19, 25, 23, 20, 9, 20, 15, 10, 5, 16, 25, 20, 24, 12, 20
Find the mode and median of this data. Are they same?
- The run scored in a cricket match by 11 players is as follows:
6, 15, 120, 50, 100, 80, 10, 15, 8, 10, 15
Find the mean, mode and median of this data. Are the three same?
- The weights (in kg.) of 15 students of a class are:
38, 42, 35, 37, 45, 50, 32, 43, 43, 40, 36, 38, 43, 38, 47
(i) Find the mode and median of this data.
(ii) Is there more than one mode?
- Find the mode and median of the data: 13, 16, 12, 14, 19, 12, 14, 13, 14
- Tell whether the statement is true or false:
(i) The mode is always one of the numbers in a data.
(ii) The mean is one of the numbers in a data.
(iii) The median is always one of the numbers in a data.
(iv) The data 6, 4, 3, 8, 9, 12, 13, 9 has mean 9.
EXERCISE-3.3
- Use the bar graph (see the given figure) to answer the following Ps.
(a) Which is the most popular pet?
(b) How many children have dog as a pet? 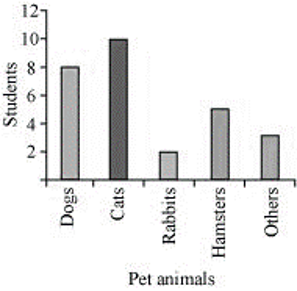
- Read the bar graph (see the given figure) which shows the number of books sold by a bookstore during five consecutive years and answer the Ps that follow:
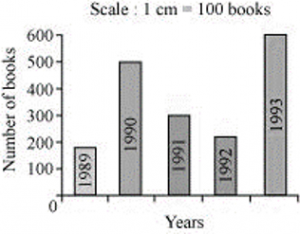
(i) About how many books were sold in 1989? 1990? 1992?
(ii) In which year were about 475 books sold? About 225 books sold?
(iii) In which years were fewer than 250 books sold?
(iv) Can you explain how you would estimate the number of books sold in 1989?
- Number of children in six different classes are given below. Represent the data on a bar graph.
| Class | Fifth | Sixth | Seventh | Eighth | Ninth | Tenth |
| Number of children | 135 | 120 | 95 | 100 | 90 | 80 |
(a) How would you choose a scale?
(b) Answer the following Ps:
(i) Which class has the maximum number of children? And the minimum?
(ii) Find the ratio of students of class sixth to the students of class height.
- The performance of students in 1stTerm and 2nd Term is given. Draw a double bar graph choosing appropriate scale and answer the following:
| Subject | English | Hindi | Moths | Science | S. science |
| 1st Term (M.M. 100) | 67 | 72 | 88 | 81 | 73 |
| 2nd Term (M.M. 100) | 70 | 65 | 95 | 85 | 75 |
(i) In which subject, has the child improved his performance the most?
(ii) In which subject is the improvement the least?
(iii) Has the performance gone down in any subject?
- Consider this data collected from a survey of a colony.
| Favourite sport | Cricket | Basket Ball | Swimming | Hockey | Athletics |
| Watching | 1240 | 470 | 510 | 430 | 250 |
| Participating | 620 | 320 | 320 | 250 | 105 |
(i) Draw a double bar graph choosing an appropriate scale. What do you infer from the bar graph?
(ii) Which sport is most popular?
(iii) Which is more preferred, watching or participating in sports?
- Take the data giving the minimum and the maximum temperature of various cities given in the following table:
| Temperatures of the cities as on 20.6.2006 | ||
| City | Max. | Min. |
| Ahmedabad | 38 ºC | 29 ºC |
| Amritsar | 37 ºC | 26 ºC |
| Banglore | 28 ºC | 21 ºC |
| Chennai | 36 ºC | 27 ºC |
| Delhi | 38 ºC | 28 ºC |
| Jaipur | 39 ºC | 29 ºC |
| Jammu | 41 ºC | 26 ºC |
| Mumbai | 32 ºC | 27 ºC |
Plot a double bar graph using the data and answer the following:
(i) Which city has the largest difference in the minimum and maximum temperature on the given date?
(ii) Which is the hottest city and which is the coldest city?
(iii) Name two cities where maximum temperature of one was less than the minimum temperature of the other.
(iv) Name the city which has the least difference between its minimum and the maximum temperature.
EXERCISE-3.4
- Tell whether the following is certain to happen, impossible, can happen but not certain.
(i) You are older today than yesterday.
(ii) A tossed coin will land heads up.
(iii) A die when tossed shall land up with 8 on top.
(iv) The next traffic light seen will be green.
(v) Tomorrow will be a cloudy day.
- There are 6 marbles in a box with numbers from 1 to 6 marked on each of them.
(i) What is the probability of drawing a marble with number 2?
(ii) What is the probability of drawing a marble with number 5?
- A coin is flipped to decide which team starts the game. What is the probability that your team will start?
- A box contains pairs of socks of two colours (black and white). I have picked out a white sock. I pick out one more with my eyes closed. What is the probability that it will make a pair?